A SaaS-style social ad generator built with Lovable and Supabase, featuring AI-powered ad creation, brand kit customization, content scheduling, and cross-platform analytics.
CIVTADS is a SaaS-style social ad generator designed to streamline how brands create, schedule, and track social media advertising across TikTok, Instagram, and Facebook. Built as a functional mockup with Lovable, the app demonstrates a full-featured dashboard experience — the only limitation being no live API integrations.
I designed and built this entire application using Lovable for rapid front-end development, with Supabase handling authentication and database infrastructure. Claude assisted with architecture decisions and feature planning throughout the process.
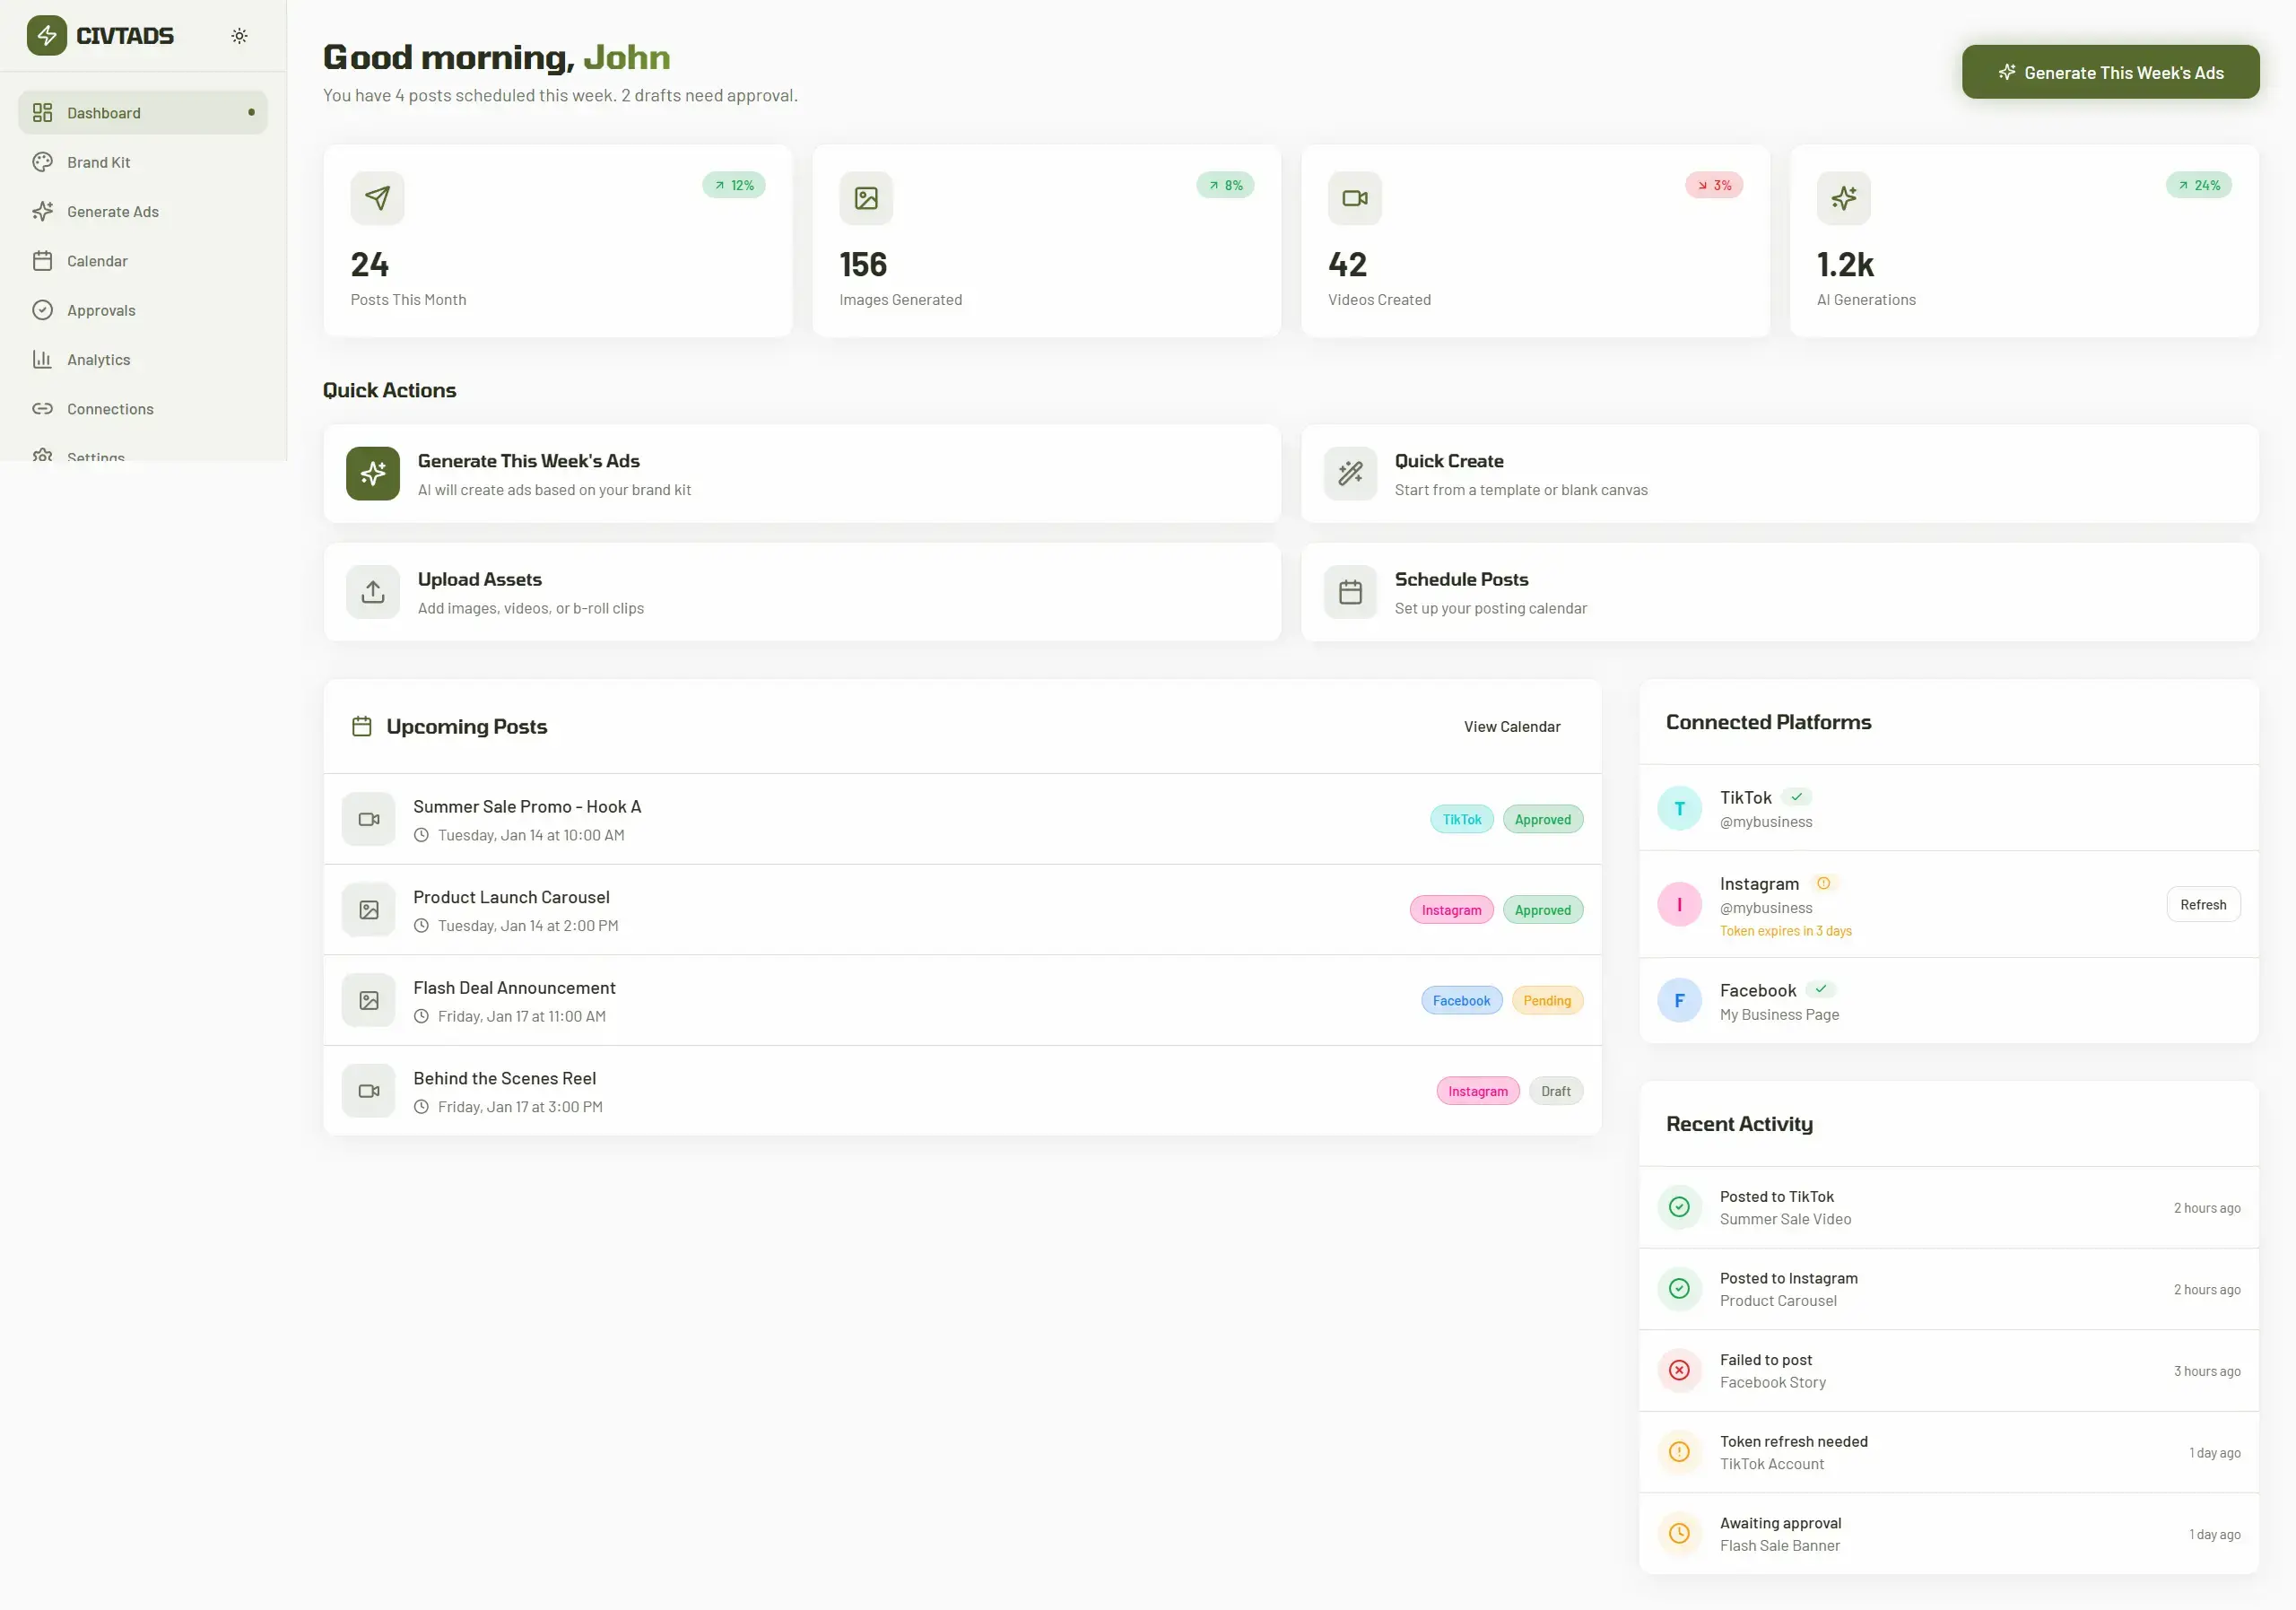
The main dashboard provides a bird's-eye view of your ad activity — posts this month, images generated, videos created, and total AI generations. Quick action cards let users jump straight into generating ads, uploading assets, or scheduling posts. A sidebar shows connected social platforms with status indicators and recent activity.
The Generate Ads page is the core of the app. Users fill out a campaign brief with their goal, offer, target audience, messaging angle, and keywords. They select which platforms to post to, choose output types (text, image, or video ads), and pick from hook styles like Question Hook, Statistic Hook, or Pain Point. The AI then generates ad variations based on the brand kit and campaign settings.
The Brand Kit page lets users define their brand identity for consistent ad generation. It captures everything from basic info like brand name and tagline to audience targeting, voice and tone preferences, color palettes, logo uploads, and brand imagery. This ensures every generated ad stays on-brand.
A full calendar view shows all scheduled posts across platforms, color-coded by platform (TikTok, Instagram, Facebook) and tagged with approval status. Users can schedule new posts directly from the calendar and get a clear overview of their content pipeline.
The analytics dashboard tracks cross-platform performance with metrics for total impressions, engagement, engagement rate, and shares. A detailed table breaks down individual post performance with likes, comments, shares, and trend indicators.